The community has asked for a review of this matter on several occasions. A voiced concern has been that the rate of coin emission for the current Proof-of-Work (PoW) reward is considered too high. It currently stands at the equivalent of ~29% annualized emission rate. Making an adjustment is not a small matter for a decentralized blockchain based cryptocurrency. Given that a PoS switch hard fork is being planned, it is a reasonable time to now actually consider and potentially implement something like this. References to such possibilities were made both in the original whitepaperas well as the contribution terms. Community feedback is welcome and expected as part of the decision making process. The reason we are not using the term “inflation” is because we are looking at the NIM coin supply and ecosystem from the perspective of a currency. In that context, the term “inflation” applies to the “purchasing value of money” which is not simply a matter of the money supply (but instead influenced by multiple factors that also include demand, productivity, etc).
The current supply curve in Nimiq 1.0 PoW was modeled after Bitcoin. The main differences Nimiq implemented were:
- Moving the comma for how many smallest units (LUNA | SATOSHI) make up the main unit (NIM | BTC). However, the total number of smallest units at final supply stayed the same. The practical idea applied was that the cost of a cup of coffee should settle in at something around 0.01 - 100.00 NIM rather than 0.0000001 - 0.001 BTC.
- Replacing halving events with a smooth change of the emission rate. This follows monetary supply economic reasoning in that smaller steady supply changes are preferable to large ones (though some will argue for the marketing value of a halving event).
Nimiq’s and Bitcoin’s current coin supply curves, by design, grow very fast in the early years (over 80% of the supply are issued within the first 10 years of the designed 100 year supply emission window). A key difference is timing: Nimiq is much younger and co-exists in a space with hundreds of other coins that weren’t around when Bitcoin went through its years of highest coin supply growth. The current total crypto market cap is distributed among a much larger number of coins. This market cap, especially for the altcoin portion, did not grow proportionally with the number of coins. Thus, the smaller coin supply growth rate that the community is calling for today is a better overall ‘fit’ to match adoption and demand.
When considering modeling a supply curve, there are a lot of degrees of freedom and more or less arbitrary choices to make. That is part of the reason why Nimiq had chosen to take a page out of the Bitcoin playbook and model its supply after Bitcoin’s in the first place. Similarly, when approaching the curve adjustment, it is necessary to reduce complexity through best effort assumptions and boundaries, so the otherwise arbitrary tasks become manageable. After thorough internal consideration and consultations with an independent economic valuation professional, we determined the following assumptions and restrictions for adjusting the curve for Nimiq 2.0 to be:
- The “coin supply growth” is effectively equal to the “network reward” (or “total reward”) emitted in time (and vice-versa). Such rewards for validators are calculated based on real-world time, not on number of blocks (the percentage of coins staked from total supply does not affect the emission rate).
- The supply curve still targets to roughly meet/cross a total supply of 21 billion NIM in ~100 years after mainnet launch. This provides an anchorpoint that relates to the original terms of the token generation and the assigned percentages for foundation, charity, contributors, etc based on that supply and time target. Another anchorpoint is the current supply at the time of switching to PoS. Purely for demonstrational purposes, the calculations use April 14 2020 as the time for this switch, as that is a simple two years since mainnet launch.
- The growth rate should continue to accommodate for the concept that, following the introduction of a currency, the earlier years support higher supply growth than the later years, when some level of saturation has been achieved.
- The supply growth should get closer to the generally accepted economic ideal of a monetary system with (positive) smaller, steadier rate changes.
- Any adjustment should consider the community expectation that the coin supply growth should be smaller than it is now.
- The initial staking reward (adjusted and non-adjusted) should compare well within the ranges of other current PoS projects of similar maturity, for competitive reasons.
- The generally accepted theory of monetary supply favors a non-finite coin supply to accommodate continuous economic and user growth. This is further supported by the idea that block rewards should not go to zero. Lastly, some amount of continuous growth helps counteract lost coins over time (although improvements in key management can be expected to reduce this issue). This needs to be considered alongside scarcity as fundamental value driver of crypto which favors limiting the long term growth.
Step 1 - Hard Boundaries
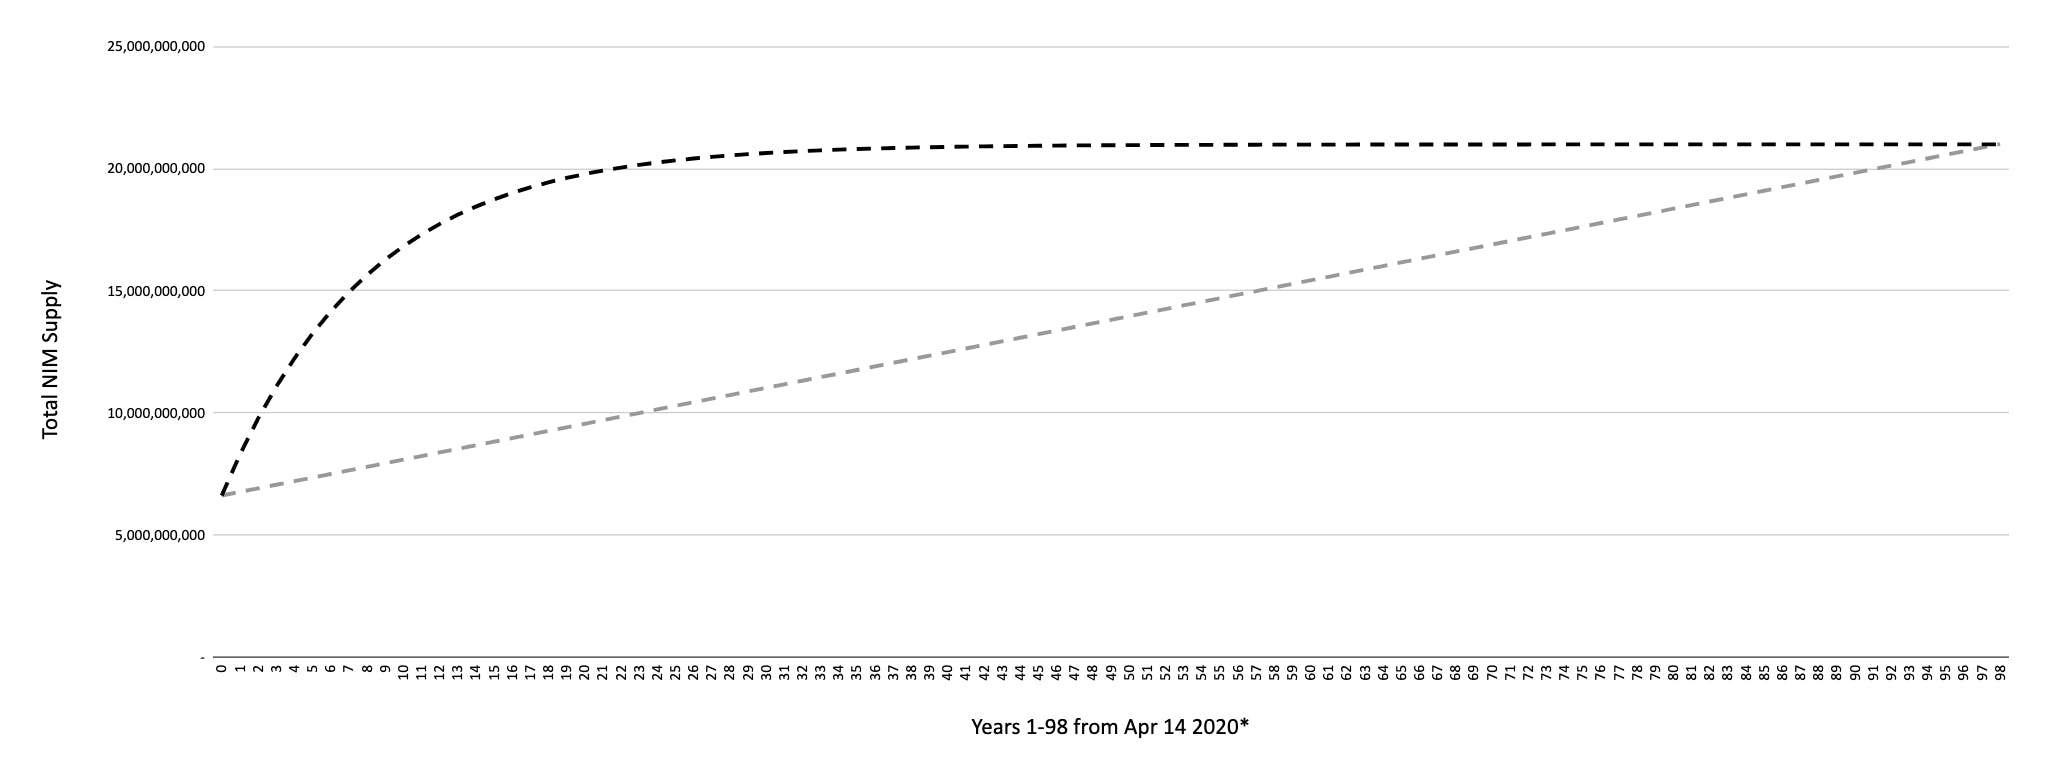
In the first conclusion we determined two absolute bounds of the supply curve. These establish the area within which any adjusted curve would be positioned:
- Boundary "CURRENT" (black dashed): The current Nimiq supply curve based on PoW network reward with approximately ~3300 NIM per minute (April 14, 2020) and a ~12% decrease in the reward rate annually, capped at 21 billion NIM after 98 years. The new supply should stay below this curve, otherwise the growth rate would conflict with assumptions #4, #5 and #6. Once crossing the 98 year anchorpoint, the adjusted supply should move above this curve, otherwise the growth rate would be zero and in conflict with #7.
- Boundary "Lower" (grey dashed): A linear growth from current NIM supply through 21 billion in 98 years, with approximately ~280 NIM per minute constant network reward. The supply should stay above this line, otherwise the growth rate would conflict with #3. Once crossing the 98 year anchorpoint, the supply should move below this line, otherwise the growth rate would again conflict with #3.
Step 2 - Soft Boundaries
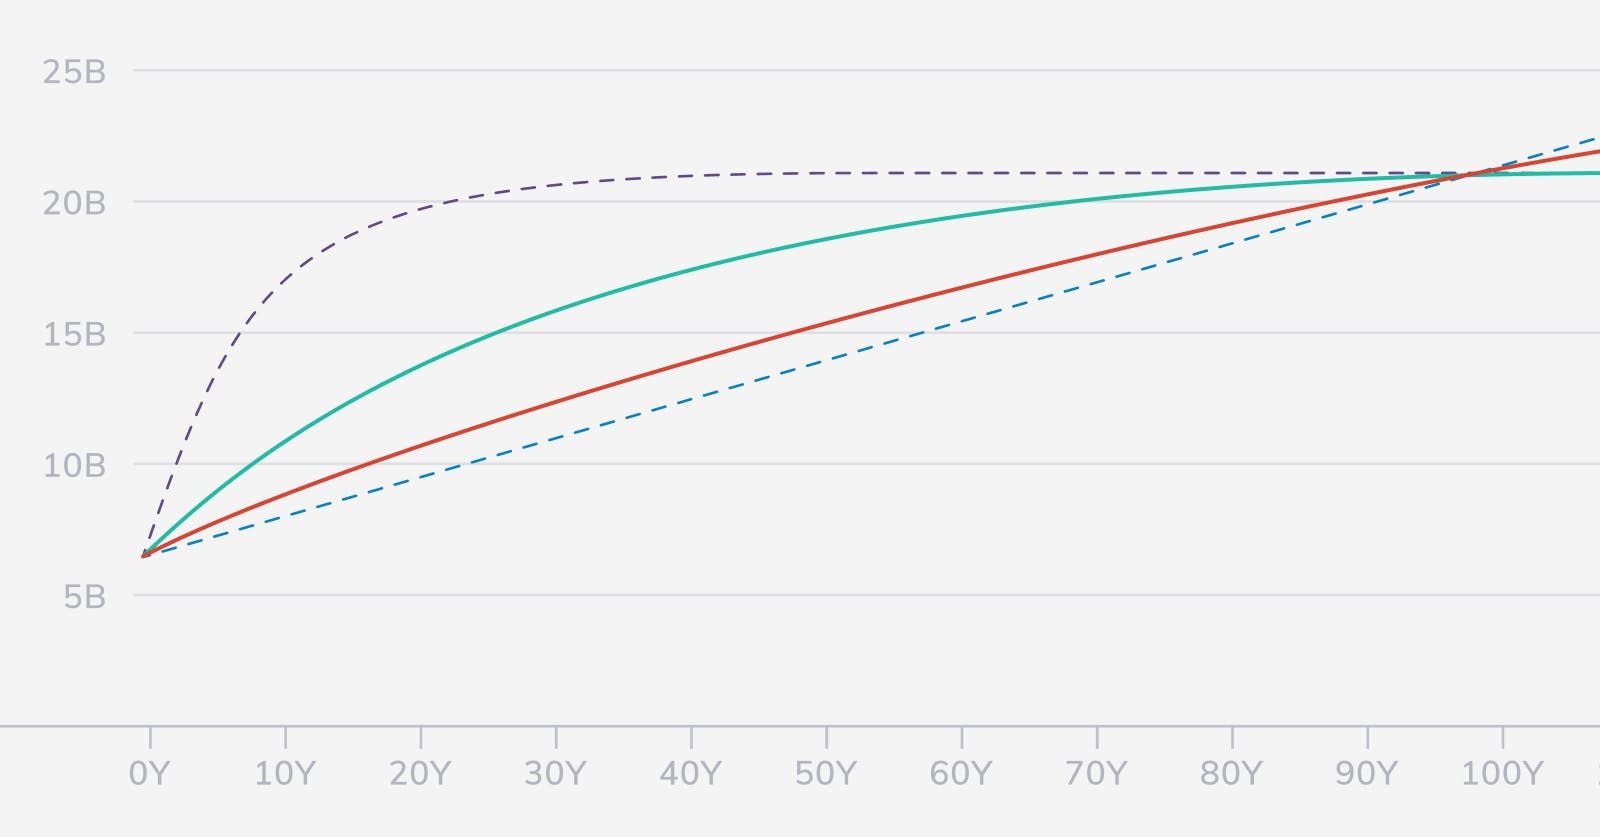
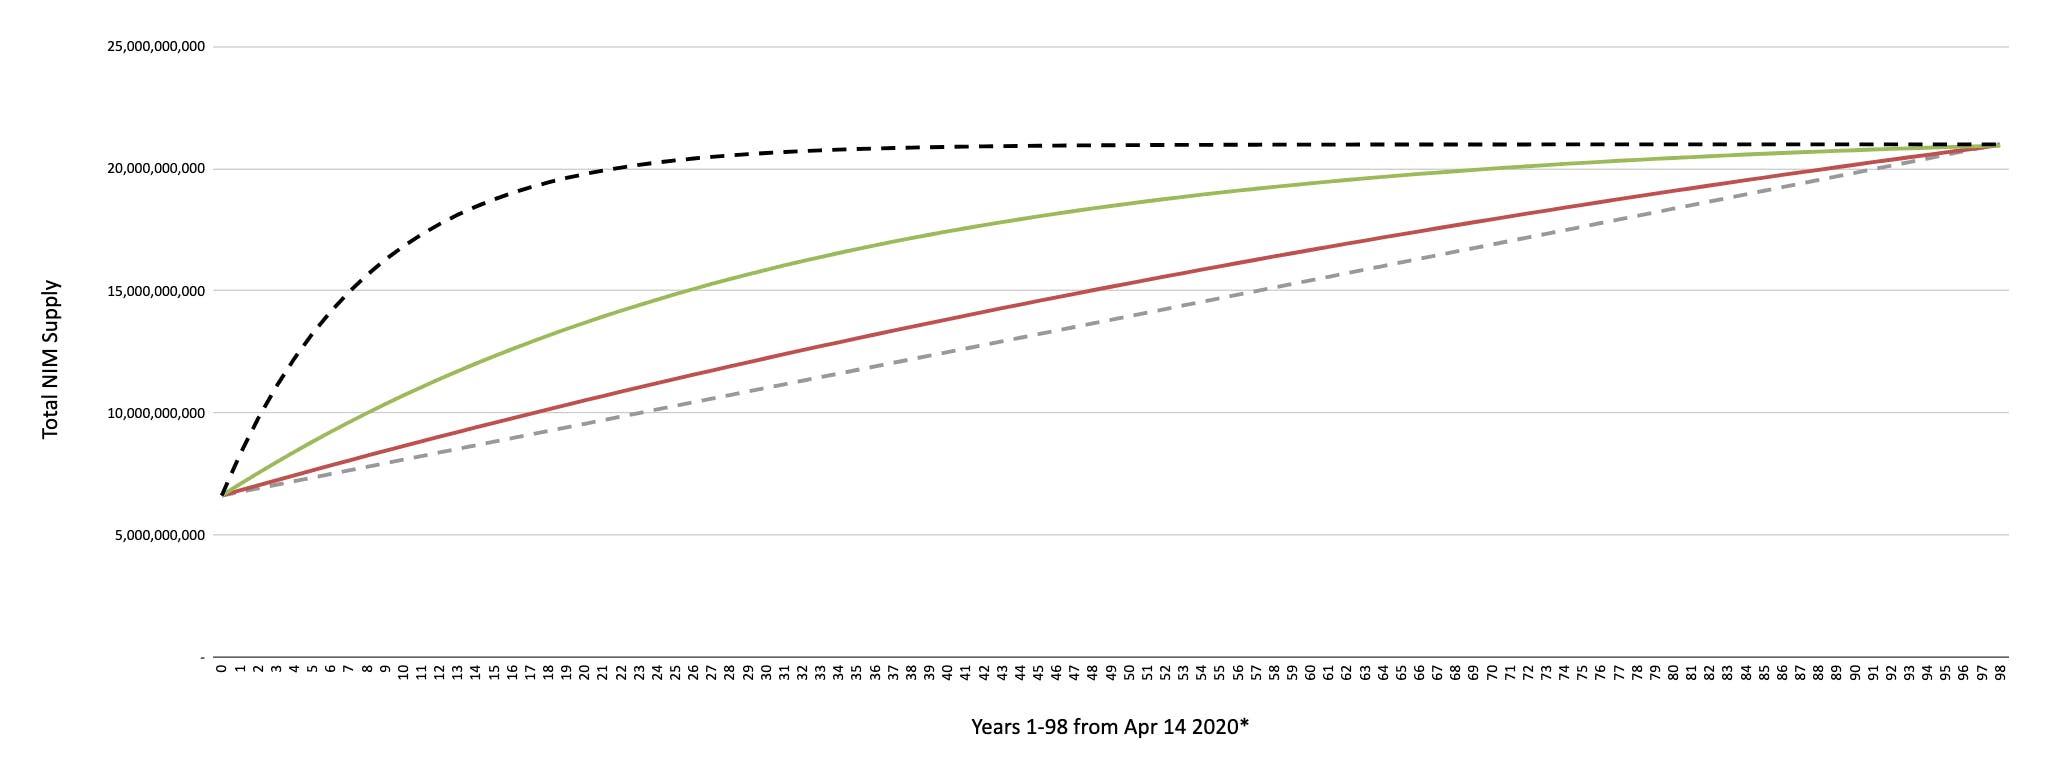
In a next step we determined two “soft” bounds that fulfill assumptions #1-#7. Both are based on smaller initial coin growth rates while in return keeping the emission/reward rate higher for longer. We do not introduce additional parameters, variables or dependencies, to keep the model as reasonably simple as possible. Either of those boundaries could also be actual choices for the new supply curve:
- Suggested Boundary GREEN: The PoS network reward starts at ~900 NIM per minute (April 14 2020) and decreases annually by ~3.15%.
- Suggested Boundary RED: The PoS network reward starts at ~400 NIM per minute (April 14 2020) and decreases annually by ~0.79%.
A hard cap to the supply may be removed, though looking beyond 100 years is somewhat of a moot discussion. Too much will surely change between now and then with regards to decentralized blockchain and cryptography. Fundamental, evolutionary technology upgrades that could require hard forks need to be taken into account, not only for Nimiq, but also for Bitcoin et al (think about quantum computing). This will provide an opportunity to reevaluate this. While maintaining a solid long-term view, for the purpose of trying to derive a decision, we believe it makes sense to somewhat prioritize the next ~25 years as equivalent to one human generation and the somewhat more “foreseeable” future.
Step 3 - Actual Numbers and Trying it Yourself
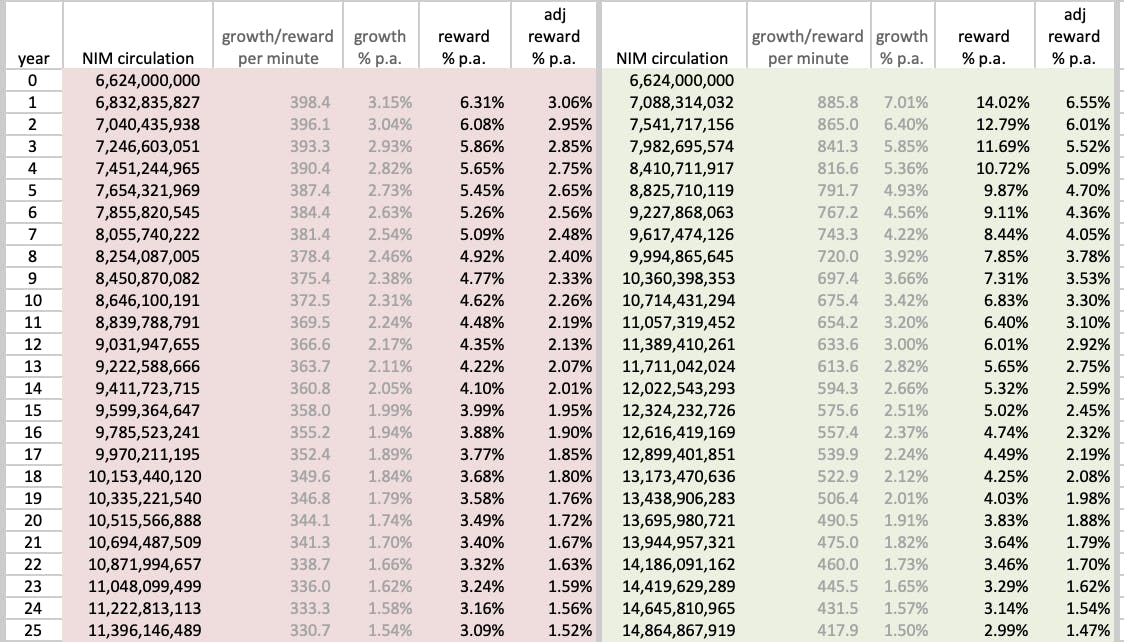
To further analyze the soft boundaries as new curve options (or option space) we provide the community with the means to simulate and further review the numbers and play with the parameters. The sheet is available for download as Open Document (.ods) and as Excel (.xlsx). The initial rate of coin emission would drop from the current 29% to between 3% - 7%. Assuming for example that 50% of the coin supply is staked, the reward return would be between 6% - 14%. Here is the preview that projects the yearly numbers for annual supply growth, reward and adjusted reward for staking (assuming re-staking) for the red and green curves:
With this we would like to open up the discussion and follow-ups from the community. A useful starting point could be the existing community forum thread that already touched on this topic.
We look forward to constructive comments and feedback on the way to making a decision with the community on potential coin supply adjustments for Nimiq 2.0. We want to hear and discuss all your opinions throughout March and, based on that, share more information regarding the next steps in a future blog post. Stay tuned.
Team Nimiq